How to Read Heatmaps in Local SEO: Eliminating "Ranking Gaps"

Table of contents
Local SEO tool
for agencies
Automate your local SEO
and track Google Maps visibility
In 2026 local SEO, manually checking rankings from a single place and on a single device no longer provides reliable data. Google clearly states that local ranking depends, among other factors, on relevance, distance, and a business’s prominence, and distance is calculated based on the searcher’s location [1]. This means the result you see from the office does not describe a company’s real visibility across the entire city.
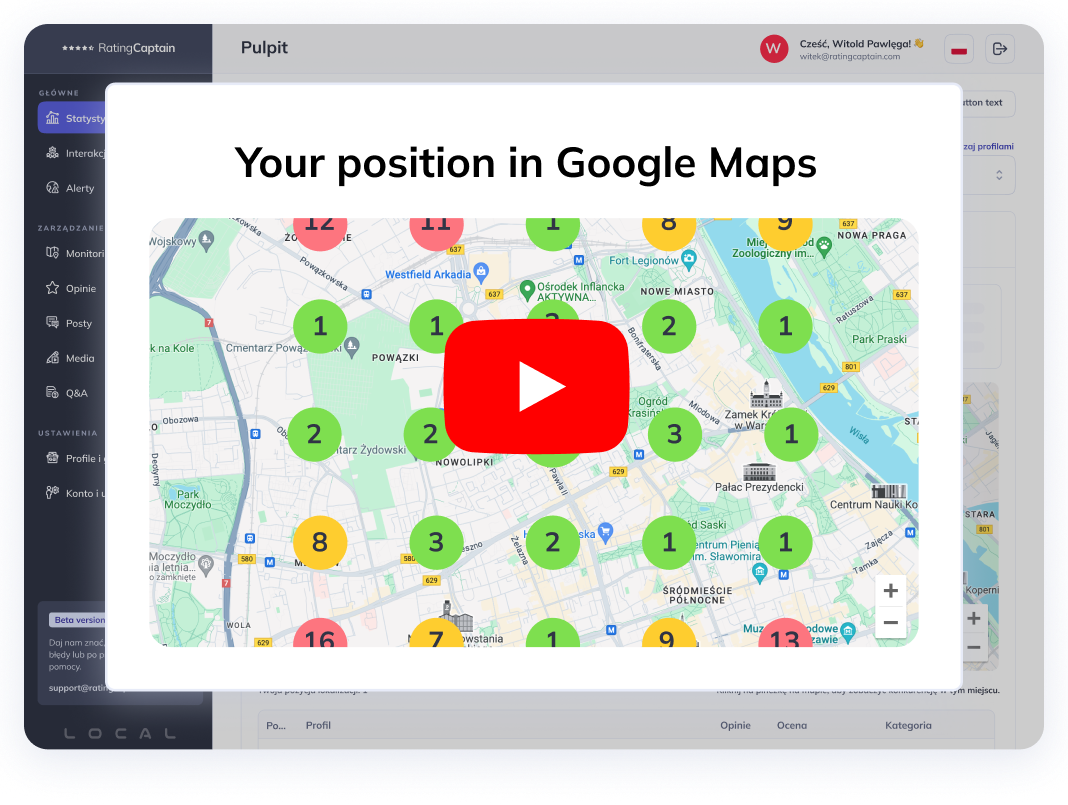
In practice, a business can rank #1 on one street and fall outside the top results just two blocks away. That’s why the Local SERP Map heatmap has become one of the key reports in local SEO today. Instead of a single ranking readout, you get a visibility snapshot across a grid of measurement points. In Rating Captain, this workflow is supported by features such as checking rankings on the map, map ranking reports, competitor monitoring, and daily rank tracking [2][3].
Heatmap vs. average position: what better reflects local visibility?
An average city-wide position may look good in a report, but it often says little about where a business is actually acquiring customers. Local businesses operate across an area, not at a single GPS point.
If a business is visible in the top 3 in one part of the city but practically nonexistent in another, the average position may still look fine - even though the business is losing calls and visits in specific neighborhoods. A heatmap solves this problem by showing the distribution of visibility on the map.
In Rating Captain, you can work with your own measurement grid (custom ranking grid), and the map can cover up to 81 measurement points [4]. This lets you see not only the overall trend, but also very specific weak zones - so-called ranking gaps.
![]()
How to read a Local SERP Map heatmap: grid and colors
A heatmap in local SEO is not just a visualization. It’s a decision-making tool. The best way to read it is in layers: first the color, then the area, and finally the query.
1. Green points (positions 1-5)
These are the strongest visibility zones. They indicate the business appears in the Local Pack and has the best chance of capturing user attention. From a business perspective, these are the most valuable areas.
Local stats roundups often mention that the Local 3-Pack captures a large share of clicks. One recent roundup indicates 44% of clicks go to Local Pack results [5]. Regardless of methodological differences between sources, the conclusion remains the same: TOP 3 on the map has real business value.
2. Yellow and orange points (positions 6-12)
These are “near-the-result” zones. The business is already visible, but it isn’t capturing its full potential. In practice, this is often the best area to optimize, because moving from positions 5-6 into the top 3 can be faster than fighting up from very low rankings.
These points show where it’s worth strengthening the profile and content first, because that’s where results can appear the fastest.
3. Red points (positions 13+)
These are “ranking gaps” (ranking holes). For users in this area, the business is practically invisible. This isn’t just an SEO problem - it’s a direct revenue loss, because local searches have high intent to act.
Google data shows that 76% of people who search for something nearby on a smartphone visit a business within 24 hours, and 28% of such searches result in a purchase [6]. If you see red zones on the heatmap, you’re effectively seeing the places where the business is handing customers to competitors.

Eliminating ranking gaps: how to act based on a heatmap
The heatmap itself is a diagnosis. The advantage appears when map data turns into a series of concrete actions. And this is where the features available in Rating Captain matter most.
1. Micro-locations: where the business is losing visibility
The most common mistake in local SEO is running actions too broadly. If the problem affects one neighborhood, there’s no point in optimizing everything “for the whole city.”
With the rank map and visibility grid, you can pinpoint exactly where the business weakens: a specific district, housing area, service zone, or ZIP/postal code. This lets you shift budget and attention where the impact will be greatest [2][3][4].
In practice, the process is simple: choose a local query, read the heatmap, identify red zones, and prioritize areas to improve.
2. Competitors on the heatmap: who is taking your visibility
The next step is comparing your visibility with competitors. Rating Captain offers competitor monitoring integrated with local data workflows [2][3].
This is crucial, because the heatmap shows where the business is losing visibility, but competitor monitoring shows who is taking that visibility. This makes the analysis concrete:
-
which businesses dominate in red zones,
-
for which queries they win,
-
which local signals they have better developed.
Only then do you see the full picture. Often the issue isn’t “all of SEO,” but a lack of reinforcement in specific micro-areas where competitors are more active.
3. GBP content by neighborhood: geo-targeting and granular relevance
After identifying a red zone, you need to close it with signals of local relevance. In Rating Captain, you can do this through post-related features, including generating content for target keywords as well as a post generator and planner [2][3].
How do you use this in practice? If the heatmap shows weak visibility in a specific neighborhood, it’s worth preparing a Business Profile post that naturally references:
-
that neighborhood,
-
local landmarks,
-
a specific service provided in that area,
-
a seasonal local context.
This strengthens granular relevance - relevance at the micro-area level, not just the whole city. In other words, the business stops being “generally from the city” and becomes clearly associated with a specific part of its service area.
4. Daily Tracking: daily control of impact on the map
In local SEO, it’s not enough to implement changes and come back a week later. Results are dynamic, and competitors react quickly. That’s why daily rank tracking isn’t an add-on - it’s the foundation of the process.
In Rating Captain, daily tracking, map ranking reports, and notifications and alerts let you work in short cycles [2][3]:
-
rank scan,
-
change in the profile or content,
-
another scan,
-
evaluate the effect on the heatmap.

This way, you don’t have to guess whether a category change, new photos, or a new post actually improved the situation. You can see the impact on the map.
5. GBP profile protection: alerts and fast response to drops
When working with heatmaps, it quickly becomes clear that not every drop comes from SEO actions. Sometimes the cause is profile changes, data inconsistencies, or other modifications that affect local visibility.
That’s why it’s important to combine rank monitoring with 24/7 profile protection and alerts [2][3]. This is especially important for multiple locations, where even a small change in one listing can translate into drops at specific grid points.
Business benefits of a heatmap in local SEO
The biggest value of a heatmap isn’t that it looks good in a report. Its value is that it allows you to:
-
see the real reach of local visibility,
-
find areas where the business is invisible,
-
compare those areas with competitors,
-
test actions and measure impact daily.
As a result, the Business Profile stops performing well only around the headquarters. It begins building more even visibility across the entire service area. That’s what eliminating ranking gaps means.
Scale also matters, especially when managing many locations. Rating Captain supports over 120,000 Google Business listings, performs over 50,000 rank scans per day, and monitors over 300,000 keywords. These numbers show the tool is built for large data volumes and also works well for multi-location operations [2].
Conclusions: how to use a heatmap to grow local visibility
In 2026, the Local SERP Map heatmap is a core report in local SEO. Manually checking rankings from a single point does not show true visibility, because local results change with the user’s location.
With the heatmap and Rating Captain features such as a visibility grid, competitor monitoring, keyword-based post generation, daily rank tracking, and alerts, you can not only detect ranking gaps but also eliminate them systematically [2][3][4]. This approach turns local SEO from one-off tests into a data-driven process.
FAQ: heatmaps in local SEO
What matters more: average position or a heatmap?
In local SEO, a heatmap matters more because it shows real visibility across different parts of the city. An average position can hide ranking gaps in specific neighborhoods [1][4].
What should you do first after detecting red points?
First, check which queries and which areas have the weakest visibility, then compare them with competitors. The next step is strengthening the GBP profile and content for those micro-locations - ideally with daily monitoring of results [2][3].
How often should you analyze the heatmap?
Ideally regularly, not occasionally. With daily tracking and map ranking reports, you can monitor changes continuously and react faster to drops or competitor actions [2][3].
Sources
[1] Google Business Profile Help, Tips to improve your local ranking on Google.
[2] Rating Captain, Local SEO Tool.
[3] Rating Captain, Free Google Rank Tracker Reports.
[4] Rating Captain Help Center, Rating Captain Local - Knowledge Base.
[5] RedLocal Agency, 15+ Google Local Pack Statistics and Facts (2025 Updated).
[6] Think with Google, How Mobile Search Connects Consumers to Stores.
Share this article
Short description (you can edit)
Tip: you can edit the description before sharing on WhatsApp or adding as Facebook quote
Author of the post
Local SEO Specialist
Julia is responsible for local SEO activities and supports Rating Captain’s brand communication. She optimizes Google listings and co-creates strategies that enhance companies’ visibility in search results. She is passionate about consumer behavior and the latest trends in local digital marketing.
Please rate this article
Local SEO tool
for agencies
Automate your local SEO
and track Google Maps visibility